The plot method is a generic method for plotting objects
of class, "cvCovEst". The method is designed as a tool for diagnostic
and exploratory analysis purposes when selecting a covariance matrix
estimator using cvCovEst.
Arguments
- x
An object of class,
"cvCovEst". Specifically, this is the standard output of the functioncvCovEst.- dat_orig
The
numeric data.frame,matrix, or similar object originally passed tocvCovEst.- estimator
A
charactervector specifying one or more classes of estimators to compare. IfNULL, the class of estimator associated with optimalcvCovEstselection is used.- plot_type
A
charactervector specifying one of four choices of diagnostic plots. Default is"summary". See Details for more about each plotting choice.- stat
A
charactervector of one or more summary statistics to use when comparing estimators. Default is"min"for minimum cross-validated risk. See Details for more options.- k
A
integerindicating the number of leading/trailing eigenvalues to plot. IfNULL, will default to the number of columns indat_orig.- leading
A
logicalindicating if the leading eigenvalues should be used. Default isTRUE. IfFALSE, the trailing eigenvalues are used instead.- abs_v
A
logicaldetermining if the absolute value of the matrix entries should be used for plotting the matrix heat map. Default isTRUE.- switch_vars
A
logical. IfTRUE, the hyperparameters used for the x-axis and factor variables are switched in the plot of the cross-validated risk. Only applies to estimators with more than one hyperparameter. Default isFALSE.- min_max
A
logical. IfTRUE, only the minimum and maximum values of the factor hyperparameter will be used. Only applies to estimators with more than one hyperparameter. Default isFALSE.- ...
Additional arguments passed to the plot method. These are not explicitly used and should be ignored by the user.
Value
A plot object
Details
This plot method is designed to aide users in understanding the
estimation procedure carried out in cvCovEst(). There are
currently four different values for plot_type that can be called:
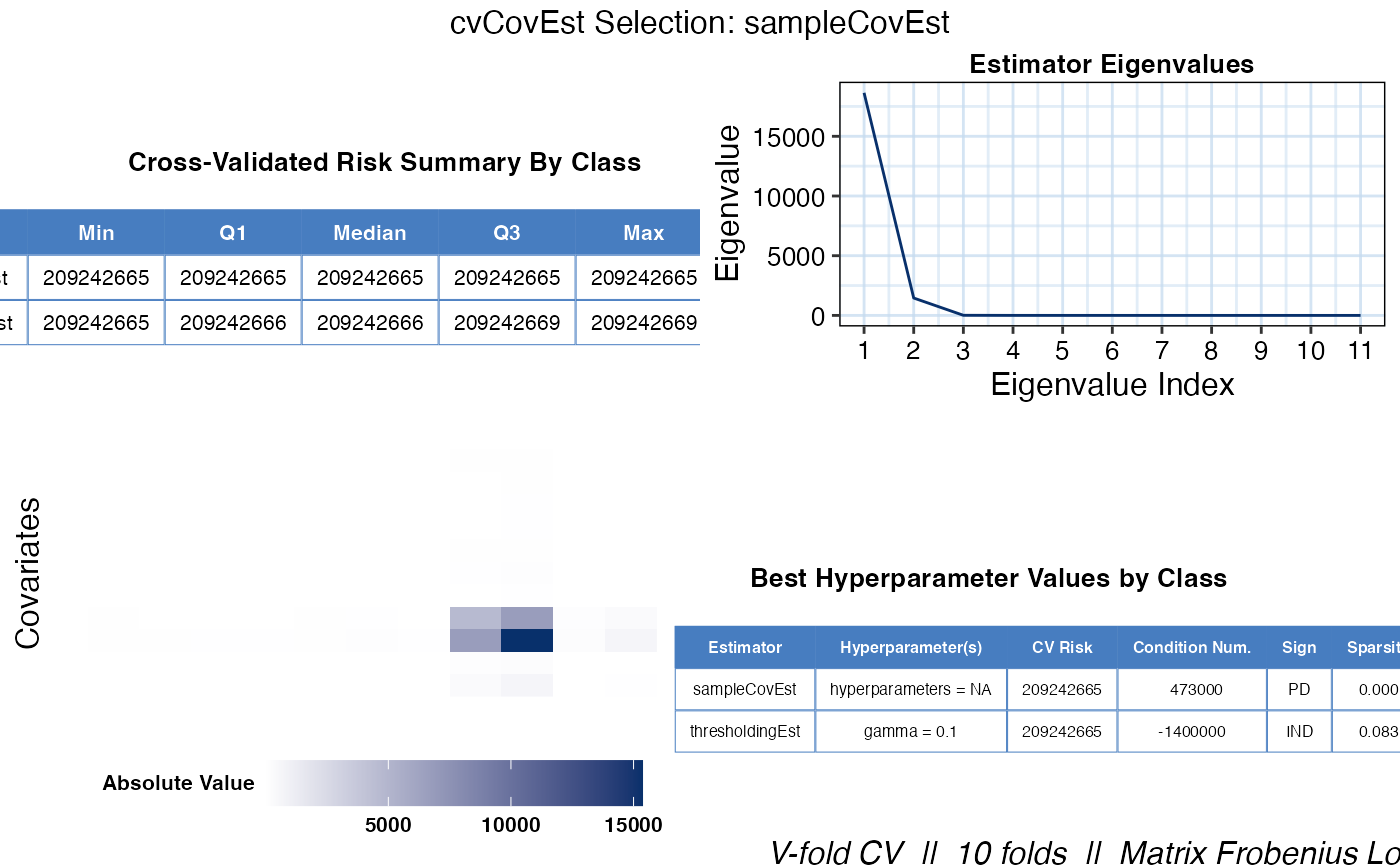
"eigen"- Plots the eigenvalues associated with the specifiedestimatorandstatarguments in decreasing order."risk"- Plots the cross-validated risk of the specifiedestimatoras a function of the hyperparameter values passed tocvCovEst(). This type of plot is only compatible with estimators which take hyperparameters as arguments."heatmap"- Plots a covariance heat map associated with the specifiedestimatorandstatarguments. Multiple estimators and performance stats may be specified to produce grids of heat maps."summary"- Specifying this plot type will run all of the above plots for the best performing estimator selected bycvCovEst(). These plots are then combined into a single panel along with a table containing the best performing estimator within each class. If the optimal estimator selected bycvCovEst()does not have hyperparameters, then the risk plot is replaced with a table displaying the minimum, first quartile, median, third quartile, and maximum of the cross-validated risk associated with each class of estimator.
The stat argument accepts five values. They each correspond to a
summary statistic of the cross-validated risk distribution within a class
of estimator. Possible values are:
"min"- minimum"Q1"- first quartile"median"- median"Q3"- third quartile"max"- maximum